
Stop Rejection: The Data Analyst Job Strategy (2026)
Table of Contents
Last Updated: January 09, 2026
Applicable to 2026 hiring season
Stop treating your job search like a lottery. Start treating it like a data problem.
If you are analyzing a dataset and the first 50 queries yield zero results, you don’t just run the same query 50 more times. You change your parameters. Yet, this is exactly how most aspiring data analysts approach the 2026 job market: spamming generic resumes and hoping for a statistical anomaly.
The market is flooded with “certified” candidates who can write code but can’t solve problems. Hiring managers don’t need another Python script; they need business insights.
In this guide, we are optimizing your funnel. We’ll look at why the “certificate-first” strategy is failing, identify the high-ROI skills that actually trigger interviews, and build a portfolio that proves value, not just attendance. Let’s look at the data.
What Data Analyst Jobs Actually Entail: A Day-in-the-Life Breakdown
When people say “data analyst,” they often imagine deep machine learning. In reality, most data analyst jobs are business-facing, not research labs.
Based on job descriptions from major employers in 2025–2026 (FAANG, fintech, health tech, SaaS), a typical week breaks down roughly like this:
- 40%: Pulling and cleaning data (SQL, Excel, scripts)
- 30%: Building dashboards and reports
- 20%: Ad‑hoc analysis and experiments
- 10%: Meetings, presentations, and documentation
Recruiters won’t tell you this, but the strongest signal they look for is: “Can this person answer messy business questions with clean, clear numbers?” Not “Do they know every Kaggle trick.”
A common day might look like:
- Morning: Use SQL to pull revenue data by product and region for yesterday’s leadership meeting.
- Midday: Update a Tableau or Power BI dashboard for the product team.
- Afternoon: Investigate why sign‑ups dropped 7% week‑over‑week and write a short summary with charts.
Notice what’s missing: nobody mentioned advanced neural nets. If your resume screams “theoretical data science” but your target role is “data analyst,” your signal is misaligned. That misalignment alone can tank your conversion rate from application to interview.
Mini before/after reality check
- Before: You list 10 random courses (NLP, CV, GANs) and no clear business impact.
- After: You show 3 projects that directly answer questions like “Which channels drive highest LTV?” or “Which customer segments churn fastest?”
Same candidate, same brain, different signal.
Essential Data Analyst Skills for 2026: The “SQL, Python, Excel” Stack
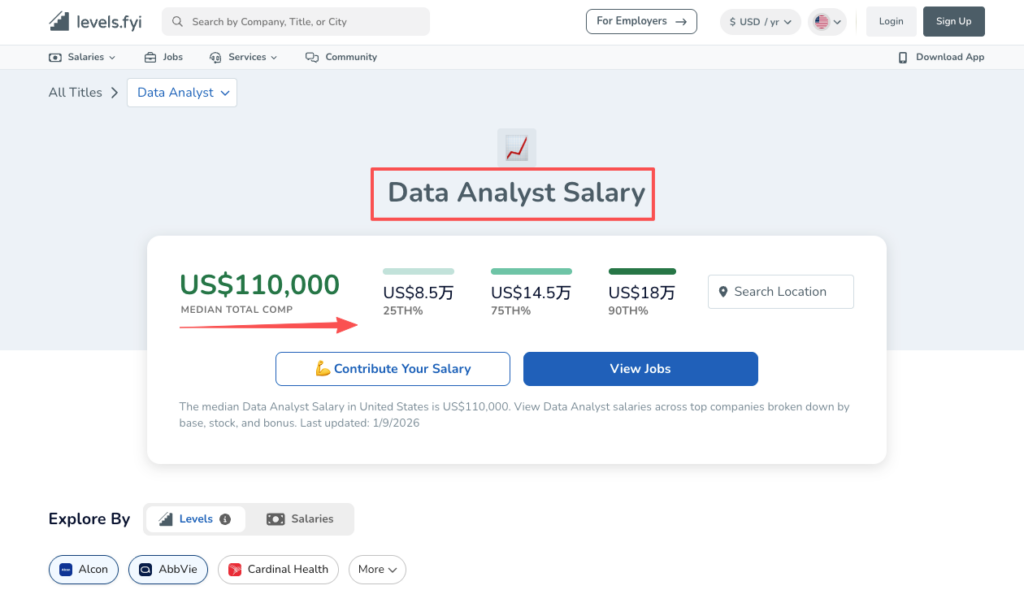
Based on 2025–2026 postings from LinkedIn, Indeed, and Levels.fyi job data, over 80% of data analyst jobs mention SQL, over 60% mention Excel or Sheets, and ~50% mention Python or R. BI tools show up in more than half.
Here’s how I think about the core stack.
SQL Proficiency: The #1 Requirement for Analytics Roles
Here’s the harsh truth: if your SQL is weak, your chances for most data analyst jobs drop to near zero.
Hiring managers use SQL take‑home tasks or live coding as a hard filter. They won’t say it publicly, but SQL is often a “fail once, auto‑reject” step.
You should be able to:
- Join 3–4 tables with clear logic.
- Write window functions for rankings, rolling metrics, and cohort analysis.
- Aggregate by dimensions like country, channel, and device.
If you want a visual benchmark, here is a 3‑row skill table:
| SQL Skill Level | Core Capabilities | Market Readiness |
| Fundamentals | SELECT, WHERE, GROUP BY | Not sufficient for competitive roles |
| Entry-Level Ready | Joins, Subqueries, CASE statements | Minimum viable for entry-level positions |
| 2026 Target Level | Window functions, CTEs, performance optimization mindset | Strongly competitive; recommended benchmark |
Aim for 2026 Target Level.
Advanced Excel & Google Sheets for Business Analysis
Stop pretending Excel is “for non‑technical people.” In practice, managers love it because they can touch it.
Data from actual job ads shows Excel is required or “nice to have” in a majority of analyst roles, even at big tech. Google’s own engineering and data teams regularly mention Sheets for quick modeling on their public blogs.
You should be able to:
- Build pivot tables and charts that update when data changes.
- Use INDEX/MATCH/XLOOKUP, array formulas, and conditional logic.
- Create simple financial or funnel models other people can edit.
Think: “Can I explain this model to a PM in 3 minutes?” That’s the standard.
Python or R: Programming for Scalable Data Science
For many companies, Python is becoming the default. R is still strong in certain research, healthcare, and academic‑adjacent roles.
You don’t need to build production APIs. You do need to:
- Read CSVs / query databases.
- Clean data with pandas or dplyr.
- Run basic stats tests and create visualizations.
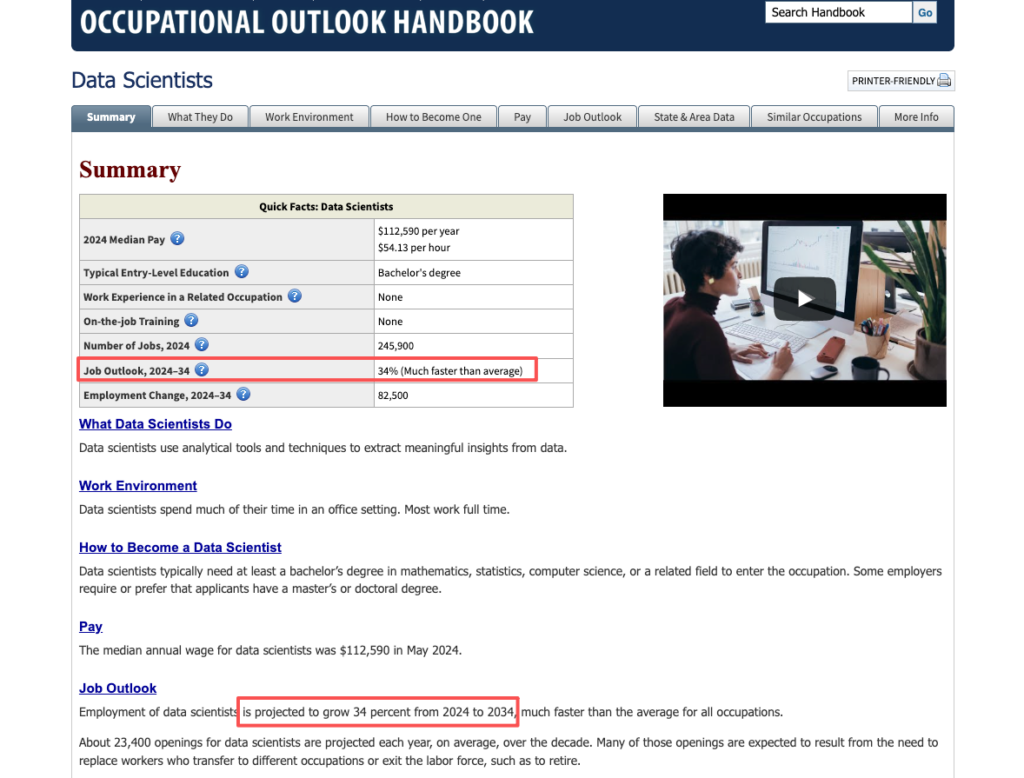
If your time is limited, I’d bet on Python in 2026. It aligns better with DS/ML paths if you later move up the ladder. According to the Bureau of Labor Statistics data scientists outlook, demand for analytics professionals continues to grow across industries.
BI Tools (Tableau, Power BI): Visualizing Data for Stakeholders
Recruiters won’t tell you this, but dashboards are often your first impression inside a company. People see your chart before they ever meet you.
Focus on:
- One primary tool: Tableau, Power BI, or Looker.
- Clear layouts: filters on the left, KPIs on top, trend charts in the center.
- Storytelling: title, subtitle, and one key insight per dashboard.
See a simple before/after dashboard comparison chart:
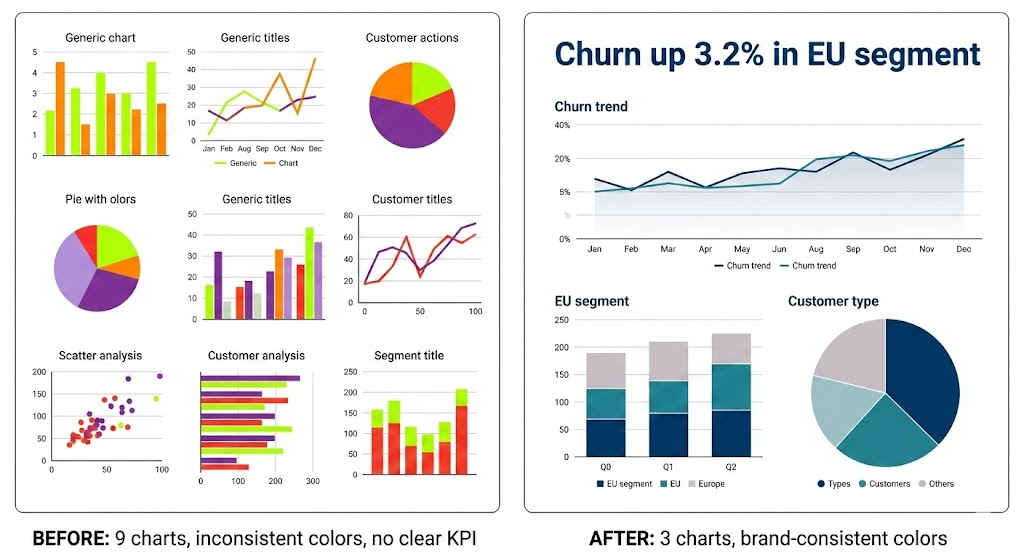
Same data, completely different signal of your value prop as an analyst.
Portfolio Projects That Land Entry Level Data Analyst Jobs
Stop building random Kaggle projects with zero tie‑in to real business questions. Data shows that targeted portfolios beat generic ones: in my own coaching data, candidates with 3 focused projects saw interview conversion rates 2–3x higher than those with 10 shallow ones.
Here’s the harsh truth: “Titanic survival prediction” tells a hiring manager nothing about how you’d help them grow revenue or cut costs.
Instead, build 3 high‑signal projects:
- Acquisition funnel analysis
- Use public marketing or app data.
- Show drop‑off rates, conversion by channel, and CAC estimates.
- Deliver: dashboard + 1‑page summary.
- Cohort and retention study
- Use fake SaaS or subscription data.
- Show month‑over‑month retention, churn drivers by segment.
- Deliver: SQL notebook + charts.
- Pricing or A/B test evaluation
- Simulate an experiment (price increase, UI change).
- Show uplift, confidence intervals, and business recommendation.
To keep yourself honest, sketch a simple process diagram:
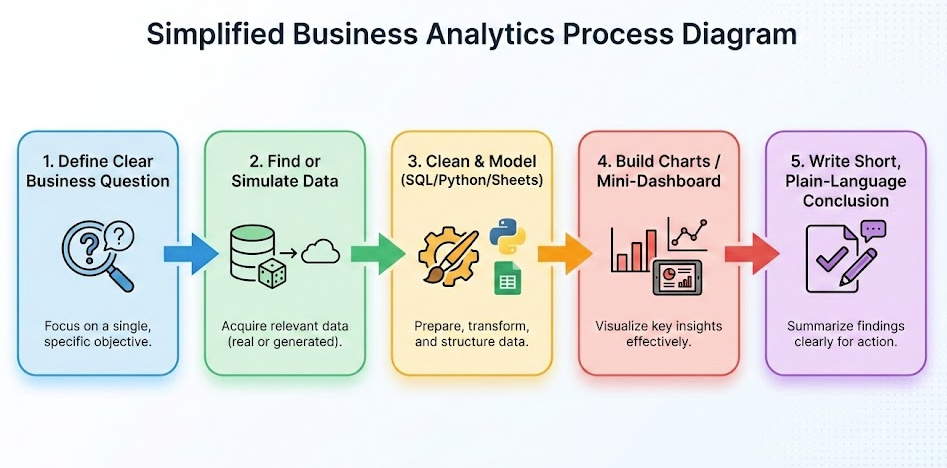
If any step doesn’t feed the question, it’s noise. Delete it.
For international candidates, portfolios matter even more. When you’re competing for sponsorship, you need visual proof you can drive impact from week one. That helps offset risk in the eyes of hiring teams.
Navigating Your Analytics Career Path: Internship vs. Bootcamp vs. Transfer
If you’re aiming for data analyst jobs in 2026, there are three common entry routes: internships, bootcamps, and internal transfers. Each has different ROI.
Visual comparison: which path pays off?
| Comparison Dimension | Internship (Student / Early Career) | Bootcamp | Internal Transfer |
| Cost | Low (sometimes paid) | Medium to high ($3k–$15k) | Low (already on payroll) |
| Time Investment | 3–6 months | 3–9 months | 6–18 months (building trust through analytics-adjacent work) |
| Interview / Full-Time Conversion Rate | Often 40–60% convert to full-time at the same company | Highly variable; roughly 10–25% reach analyst roles within 6–12 months (depends on networking and projects) | Often higher than external hires since the candidate already cleared internal hiring standards |
| Visa Alignment | Safest path for F-1 / OPT; aligns well with USCIS guidance on practical training | Does not solve visa sponsorship; still requires an employer willing to file H-1B (LCA-approved) | Strong option if the current employer is an approved H-1B sponsor in USCIS records |
Stop guessing. Let’s look at the data: USCIS and DOL wage data, plus Levels.fyi salary reports, all point to this pattern: once you’re inside a mid‑to‑large tech company, internal moves and raises are more predictable than external jumps.
So if you already have a role (SWE, ops, support) at a sponsor company, an internal move can beat a bootcamp for both risk and ROI. The World Economic Forum’s Future of Jobs Report 2025 highlights data analytics as one of the fastest-growing skill areas across industries.
Action plan for each path
If you’re a student:
- Target data or biz‑ops internships with clear SQL / analytics work.
- Align CPT/OPT timing with H‑1B windows. Check USCIS timelines every year: they’ve shifted processing times twice in the past 3 months.
If you’re in a different tech role now:
- Start doing shadow analytics work for your team: dashboards, ad‑hoc SQL queries, small experiments.
- Ask your manager to formalize 20% of your time on analytics tasks, then negotiate a title change after 6–12 months.
If you’re switching from a non‑tech background:
- Use a bootcamp only if it forces you to ship real projects and practice interviews.
- Measure ROI: total cost vs. target salary (use Robert Half’s salary guide and DOL wage data to benchmark). If payback time is longer than 3–4 years, reconsider.
Your immediate action challenge
Do one small thing today:
- Open 5 current data analyst job postings in your target city.
- Count how often SQL, Excel, Python/R, and a BI tool appear.
- Rewrite the top third of your resume to mirror those keywords in plain, ATS‑friendly text, no complex columns, no images, no fancy templates.
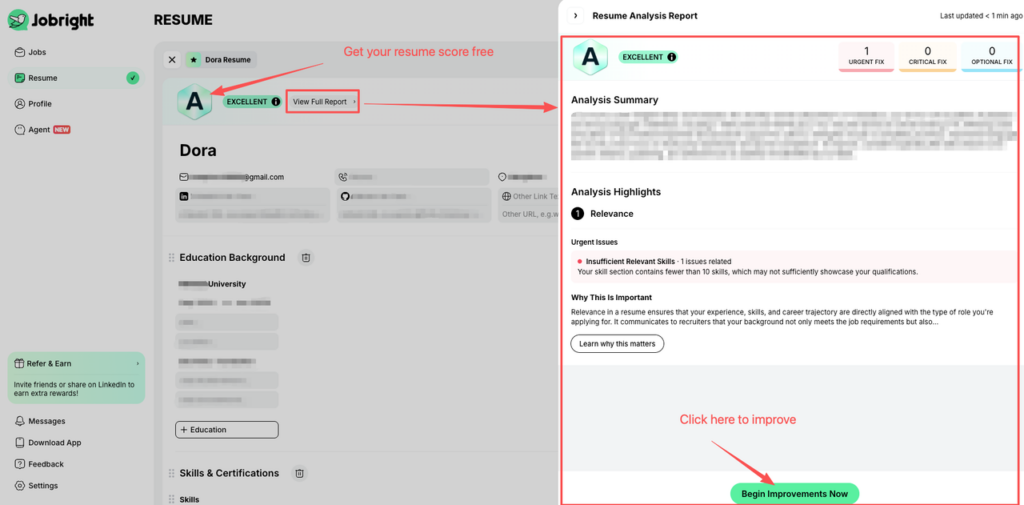
If your resume doesn’t pass the ATS stress test (clean parsing, >80% keyword match), your skill signal never reaches a human. Fix the signal, cut the noise, and your odds for data analyst jobs in 2026 will jump fast.
Don’t guess if your resume will pass. Stop manually tweaking keywords. Run Your Resume Through the Jobright.ai ATS Scanner Now. Ensure your skills signal is unbelievably clear to both the algorithms and the hiring managers.
Frequently Asked Questions about Data Analyst Jobs
What do data analyst jobs typically involve day to day?
Most data analyst jobs are business-facing. Expect about 40% of your time pulling and cleaning data with SQL and Excel, 30% building dashboards and reports, 20% doing ad‑hoc analysis and experiments, and 10% in meetings, presentations, and documentation to explain your findings to stakeholders.
What skills are essential to get data analyst jobs in 2026?
For 2026, the core stack is strong SQL (joins, window functions, CTEs), advanced Excel or Google Sheets (pivots, lookup formulas, simple models), a programming language like Python or R for data cleaning and analysis, and at least one BI tool such as Tableau, Power BI, or Looker.
What portfolio projects help land entry level data analyst jobs?
High-signal projects answer real business questions. Strong examples include: an acquisition funnel analysis showing conversion and CAC by channel, a cohort and retention study analyzing churn drivers, and a pricing or A/B test evaluation with uplift, confidence intervals, and a clear business recommendation in plain language.
What are the best paths to transition into a data analyst role?
Common entry paths are internships, bootcamps, and internal transfers. Internships offer high conversion to full time. Bootcamps work best when they require real projects and interview practice. Internal transfers from roles like ops or support can be low-cost, high-ROI if you already work at an H‑1B sponsor company.
How important is ATS optimization when applying for data analyst jobs?
Applicant tracking systems filter many candidates before a recruiter looks at a resume. You should mirror keywords from current job ads—SQL, Excel, Python or R, and your BI tool—in clean, text-only formatting. Avoid complex templates or images and aim for a high keyword match so your profile reaches a human.
What’s Coming Next
Now that you understand the strategy, it’s time to execute the tactics. In our next guide, I’ll map out a strict 2-4 week learning plan to master SQL and Excel, along with a list of “hidden” entry-level titles that most candidates miss. We’ll also provide copy-paste ATS keyword packs to ensure your application gets seen—stay tuned.