
Entry Level Data Analyst Jobs Remote: Learning Plan + ATS Resume Tips

Table of Contents
Last Updated: January 12, 2026, Applicable to 2026 hiring season
If your job search was a dataset, the trend line would be concerning.
You are applying purely based on volume—treating the hiring process like a numbers game. But in data analytics, volume without precision is just noise. If a query returns zero results 87 times in a row, you don’t keep running the same query; you debug the code.
It’s time to debug your strategy for landing entry level data analyst jobs remote. The bottleneck isn’t usually your lack of experience; it’s a misalignment between your “data signal” and what the ATS algorithms are programmed to detect.
In this guide, we stop spamming and start optimizing. You will learn how to:
- Decode the Job Title: Find the hidden entry-level roles that don’t actually use the words “Junior Analyst.”
- Engineer Your Funnel: A 4-week roadmap to build the exact portfolio hiring managers buy.
- Pass the Parsing Test: Hit 80%+ keyword relevance without keyword stuffing.
- Show, Don’t Tell: Build 3 specific SQL projects that prove ROI instantly.
Hidden Titles for Entry Level Data Analyst Jobs Remote (That Most Miss)
Recruiters won’t tell you this, but most “entry level” data jobs don’t say “entry level data analyst” in the title.
Based on recent postings I’ve tracked across LinkedIn and Indeed, fewer than 30–40% of junior-friendly analytics roles actually use “Data Analyst” + “Entry Level” together. The rest hide under less obvious titles.
Here are remote-friendly titles you should be searching for instead:
- Business Intelligence Analyst
- Reporting Analyst / Reporting Specialist
- Operations Analyst (Analytics or Metrics in description)
- Marketing Analyst / Growth Analyst (SQL + dashboards)
- Customer Insights Analyst / Product Analytics Associate
- Data Associate / Data Operations Coordinator
Signal vs. noise rule: if the description mentions SQL, dashboards, Excel, KPIs, or A/B tests, it’s a potential entry level data analyst remote job, even if the title looks sideways.
For international candidates, add a visa filter:
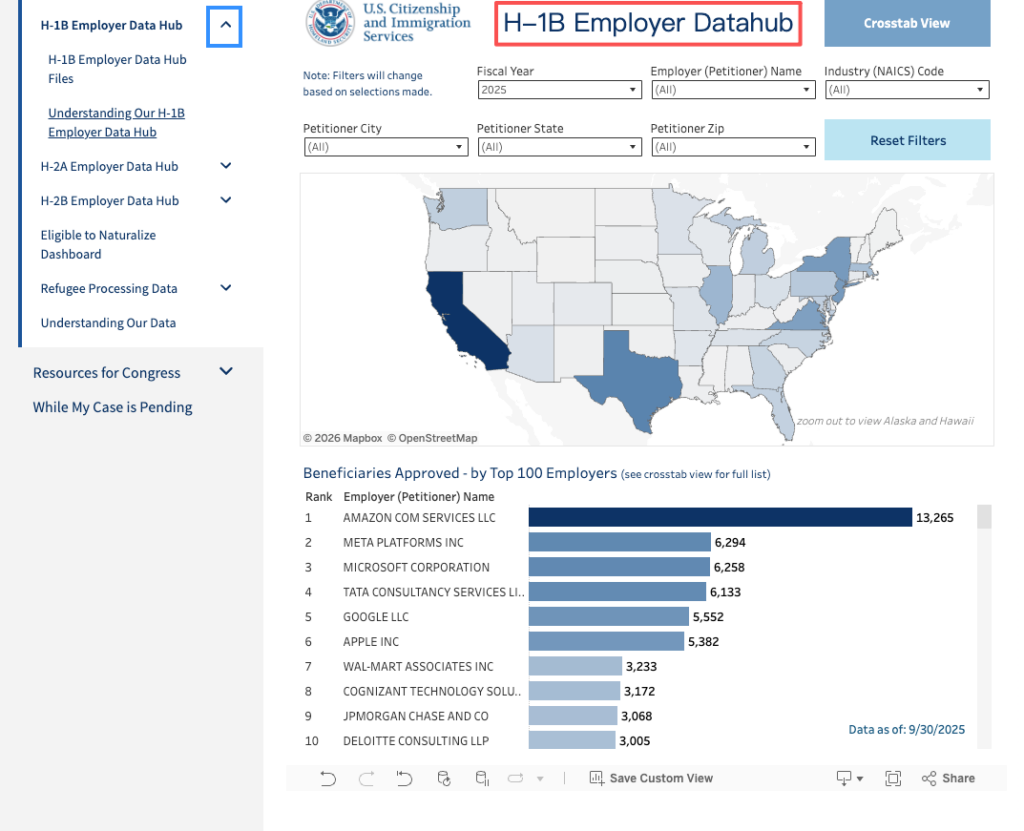
- In the US, check the employer against the H‑1B disclosure data from the Department of Labor and USCIS. If the employer has recent LCAs for “Data Analyst,” “Business Analyst,” or “Computer Occupations,” they’re more likely to sponsor again.
Mini checklist when scanning a posting:
- Mentions SQL or database querying? Signal.
- Mentions Tableau/Power BI/Looker? Signal.
- Mentions “1–2 years experience” but tasks look basic and there’s training? Still apply. That’s HR noise.
- No clear tools, only vague “fast-paced environment” language? Likely noise.
If you only search for “entry level data analyst remote,” you might be ignoring 50–60% of suitable roles. Stop doing that immediately, data shows you’re cutting your own conversion rate in half.
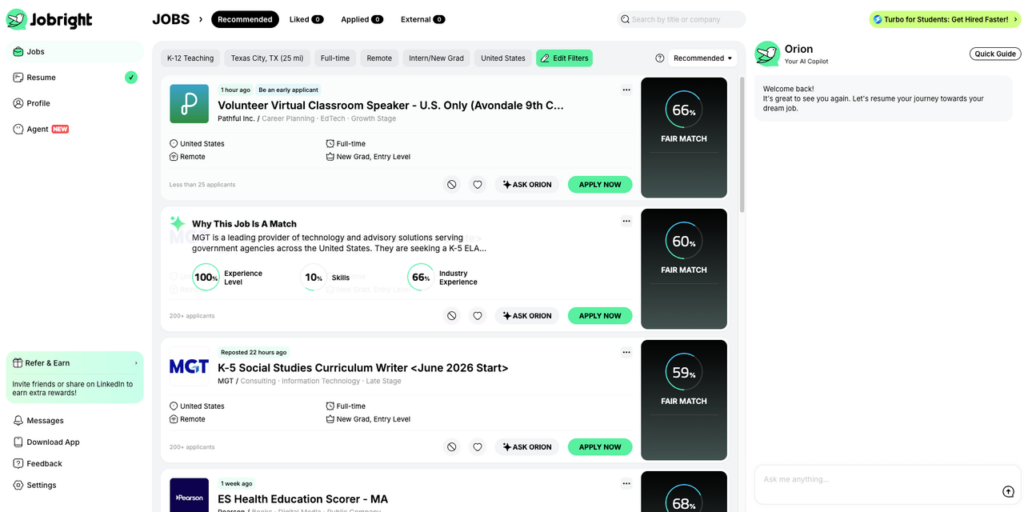
The Smart Shortcut: Don’t waste hours manually guessing titles. I use jobright.ai to scan job descriptions – not just headers. It instantly uncovers those “hidden” SQL roles that standard keyword searches miss.
The 4-Week Roadmap to Landing Junior Data Analyst Remote Roles
Most people “study” for months with no direction. They watch random tutorials and then wonder why interviews fall apart.
Here’s the harsh truth: remote employers don’t care how many courses you watched. They care whether you can query real data, clean it fast, and explain decisions.
Below is a 4-week roadmap I’d use if I had to re-enter the market today.
| Week | Skill Focus | Daily Time (hrs) | Output |
| Week 1 | SQL Basics (SELECT, WHERE, GROUP BY) | 1.0 – 1.5 | Set of clean practice queries (LeetCode/SQLBolt) |
| Week 2 | SQL Intermediate (Joins, Window Functions) | 1.0 – 1.5 | Business Insight Doc (e.g., “Top 10 Customers”) |
| Week 3 | Excel & Logic (Pivots, VLOOKUP, KPIs) | 1.0 – 1.5 | Subscription App KPI Dashboard (DAU, Churn) |
| Week 4 | Visualization (Tableau / Power BI) | 1.0 – 1.5 | Marketing Performance Dashboard (Funnel Analysis) |
You should see at least 1 concrete artifact per week (query set, Excel model, dashboard, or project).
Week 1–2: Mastering SQL Fundamentals for Real-World Analysis
SQL is non-negotiable. According to in-demand data analyst skills research, over 70% of entry-level analytics roles list SQL as required or strongly preferred.
Focus on:
- SELECT, WHERE, ORDER BY, GROUP BY, HAVING.
- JOINs (INNER, LEFT, RIGHT) on real business data (orders, users, sessions).
- Basic window functions (ROW_NUMBER, RANK) for ranking and deduping.
Daily strategy (60–90 minutes):
- 20–30 min: Targeted drills on a site like LeetCode (Data section) or SQLBolt.
- 30–40 min: Rewrite queries from real engineering or data blog posts (e.g., Meta and Google engineering blogs often show analytics-style queries: imitate those patterns).
- 10–15 min: Document one insight from your queries (trend, anomaly, conversion rate change).
Mechanism check: after two weeks, you should be able to answer:
- “Show me the top 10 customers by revenue last quarter.”
- “Find users who installed the app but never made a purchase.”
If you can’t, you’re not ready for remote interviews yet, keep drilling.
Week 3–4: Advanced Excel & Dashboard Visualization (Tableau / Power BI)
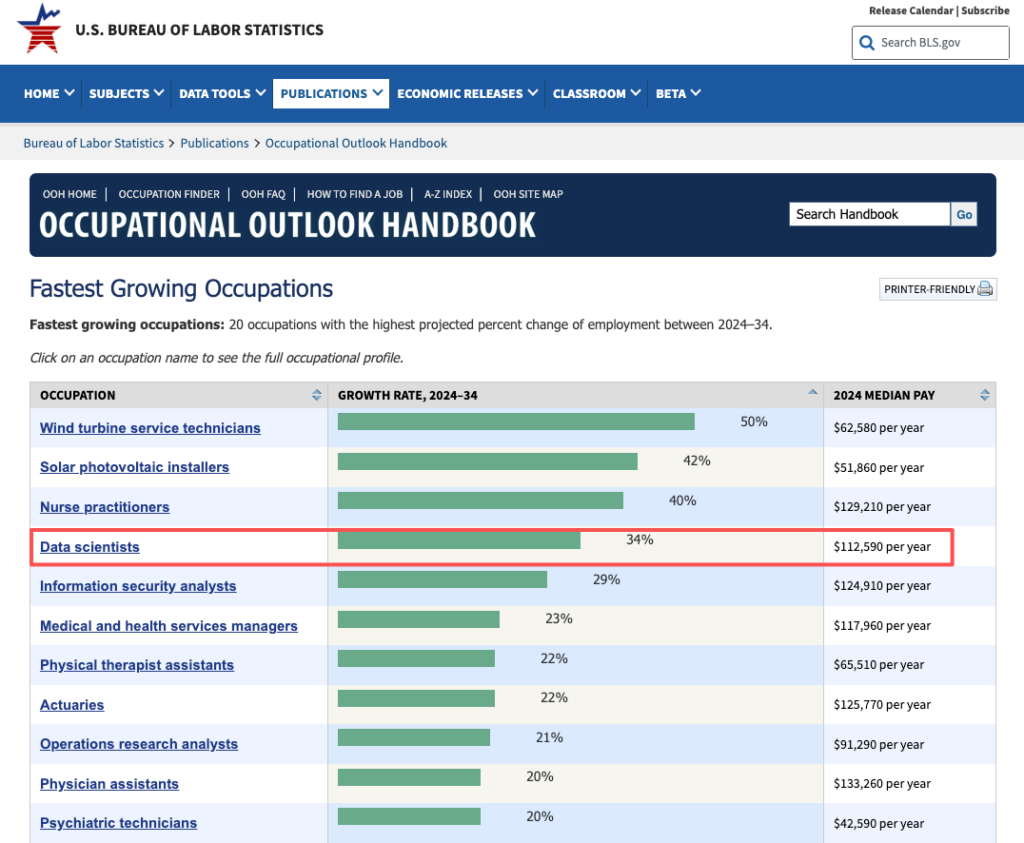
According to the U.S. Bureau of Labor Statistics occupational outlook, Excel and dashboard tools still appear in 60%+ of analyst descriptions (2025 snapshots). That’s not going away.
Focus on:
- Excel/Sheets: VLOOKUP/XLOOKUP, INDEX-MATCH, PivotTables, conditional formatting, simple financial or funnel models.
- Tableau / Power BI: Connecting to CSV/SQL, building 2–3 core views: time-series metric, funnel view, cohort or segmentation.
Create one dashboard per week:
- Week 3: A KPI dashboard for a hypothetical subscription app (DAU, MAU, churn rate, conversion rate from free to paid).
- Week 4: A marketing performance dashboard (impressions → clicks → signups → purchases).
Signal vs. noise rule: if your portfolio shows finished dashboards answering business questions, that’s 10x stronger than listing 8 tools on your resume. Remote managers need evidence you can explain metrics without standing in the same room.
Copy-Paste Ready: Essential Data Analyst ATS Keywords for 2026
Here’s the harsh truth: if your resume doesn’t hit 80%+ keyword match in ATS parsing tools, you’re volunteering to be filtered out.
Stop guessing. Let’s look at the data from current postings for entry level data analyst jobs remote. Across multiple job descriptions, the same clusters keep appearing.
Core ATS keyword groups (keep formatting clean, no text boxes):
Databases & Querying
SQL, PostgreSQL, MySQL, BigQuery, Data warehouse, Joins, Aggregations, Window functions
Analytics & BI Tools
Excel, Google Sheets, PivotTables, Tableau, Power BI, Looker, Dashboard, Data visualization
Statistics & Metrics
A/B testing, Hypothesis testing, Confidence interval, Conversion rate, KPI, Funnel analysis, Cohort analysis
Data Workflow
ETL, Data cleaning, Data validation, Data quality, Data pipeline, CSV, API
Business Context Keywords (match to industry):
- E‑commerce: cart abandonment, average order value, retention, churn.
- SaaS: MRR, ARR, activation rate, feature adoption.
- Marketing: CTR, CPA, ROAS, campaign performance.
To stress-test your resume, run it through an ATS-style analyzer (e.g., Resume Worded or Jobscan equivalents) and aim for 80–90% keyword matchwithout breaking formatting. That’s the ATS Stress Test.
Mechanism: plain text, consistent headings (Experience, Skills, Projects), no columns or images. The algorithm needs clean parsing to recognize your value prop.
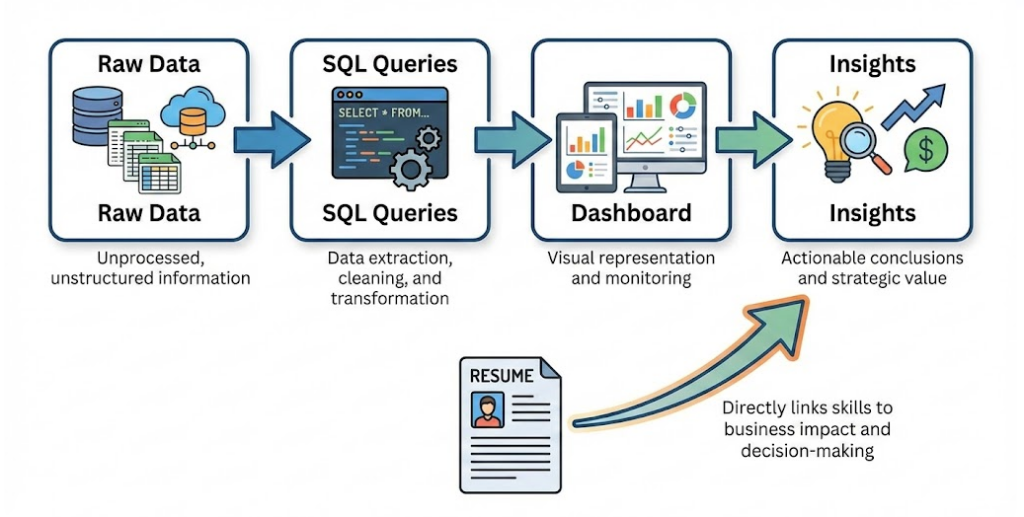
Building Your Analytics Portfolio: 3 High-Signal SQL Projects
Recruiters won’t tell you this, but for junior remote roles, portfolio > certificates.
I want you to ship three projects that pass this filter: “Could a PM or engineer skim this in 2 minutes and understand my impact?”
Project 1: E‑commerce Conversion Funnel Analysis
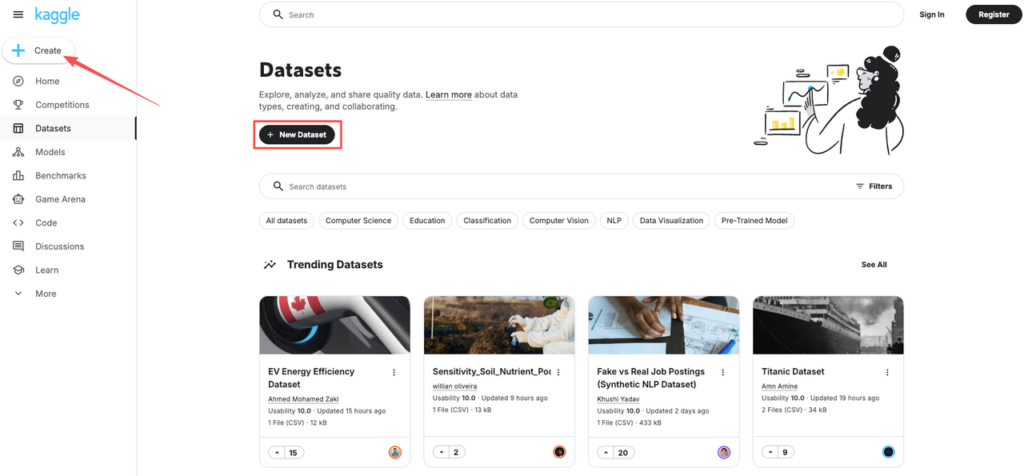
- Dataset: public e‑commerce sample sets on Kaggle or open data portals.
- SQL focus: joins across users, sessions, orders.
- Output: identify drop-off points from visit → add-to-cart → purchase and propose 2 changes.
Project 2: Subscription Churn Deep-Dive
- Dataset: fake subscription app (users, payments, events).
- SQL focus: cohorts by signup month, churn rate after 30/60/90 days.
- Output: a short write-up and one dashboard (Tableau/Power BI) with churn trends.
Project 3: Marketing Channel Performance Dashboard
- Dataset: ad campaigns, clicks, signups, revenue.
- SQL focus: channel-level ROAS, CPA, LTV by channel.
- Output: an interactive dashboard plus 3 insights for where to cut or increase spend.
Bonus: include a one-page README for each project in plain language. This helps international and non-technical stakeholders follow your logic and shows you can align analysis with business decisions. For inspiration on structuring your projects, explore beginner data analytics project examples and consider building a data analyst portfolio on DataCamp to showcase your work professionally.
Application Strategy: Batching & Referrals to Secure Remote Analytics Jobs
If you’re applying one-by-one whenever you “feel like it,” you’re leaking time and motivation.
Based on both my experience and LinkedIn’s talent research for 2026, candidates with referrals see up to 4x higher response rates compared to cold online applications.
Here’s the strategy I recommend:
- Weekly Application Batching (Signal-First)
- Day 1: Identify 15–20 roles (including hidden titles from above).
- Day 2: Tailor resumes in 3 templates: product analytics, marketing analytics, operations/reporting. Swap keywords, not formatting.
- Day 3: Run the ATS Stress Test for your 3 templates. Fix parsing issues, aim for 80%+ keyword match.
- Referrals in Parallel
- For each target company, find 1–2 people with data or product titles on LinkedIn.
- Send a tight message: who you are, one line about a relevant project, and the specific role link.
Simple script:
“Hi [Name], I’m a junior data analyst focused on SQL + Tableau. I built a funnel dashboard similar to [Company]’s product. Could you take a quick look at my 3-line summary and let me know if I’m close to what your team values? Happy to share my portfolio if useful.”
Don’t beg for a referral: ask for feedback. That opens the door to insider connection without pressure.
- For Visa-Dependent Candidates
- Check employers in the USCIS H‑1B Employer Data Hub and the DOL disclosure data. Prioritize companies that sponsored in 2023–2025 for analyst or software roles, those are more likely to navigate OPT/CPT and H‑1B again. Understanding the outlook on H-1B visas and immigration in 2026 can help you time your applications strategically.
- Track your own metrics in a simple sheet: roles applied, ATS match %, interview conversion rate, sponsorship history.
Signal vs. noise rule: if a tactic doesn’t move your response rate, interview count, or offer count, it’s noise. Cut it.
Action challenge (do this in the next 24 hours):
- Rewrite your job search to include 3 hidden titles from the first section.
- Build one ATS-optimized resume and run it through a parser: push it to 80%+ keyword match without breaking formatting.
- Identify 5 companies that show up in recent DOL/USCIS sponsorship data and save them to a “Remote Data Targets” list.
You don’t need 500 applications. You need sharp signal, clean parsing, and a focused strategy for entry level data analyst jobs remote. Start there, and the black hole gets a lot smaller.
The data analyst field is among the fastest-growing occupations, making now an excellent time to enter the market with the right strategy.
Frequently Asked Questions
How do I find entry level data analyst jobs remote if the title doesn’t say “entry level”?
Many junior-friendly roles hide under titles like Business Intelligence Analyst I, Reporting Analyst, Operations Analyst, Marketing Analyst, or Customer Insights Analyst. If a remote job description mentions SQL, dashboards, Excel, KPIs, or A/B testing, treat it as a potential entry level data analyst role even without “entry level” in the title.
What skills should I focus on first to land remote junior data analyst roles?
Start with SQL fundamentals (SELECT, JOINs, GROUP BY, basic window functions), then add strong Excel or Google Sheets skills and at least one dashboard tool like Tableau or Power BI. Aim to produce weekly artifacts—queries, models, or dashboards—that clearly answer business questions and can be shown in your portfolio.
How can I optimize my resume for entry level data analyst jobs remote and pass ATS filters?
Use clean formatting with plain text, standard headings, and no columns or images. Include common keyword clusters: SQL and databases, Excel and dashboards, statistics and A/B testing, ETL and data cleaning, plus industry terms (e‑commerce, SaaS, or marketing). Run your resume through an ATS-style analyzer and aim for 80–90% keyword match.
What portfolio projects are best for breaking into remote data analyst roles?
Create three high-signal projects: an e‑commerce conversion funnel analysis, a subscription churn deep-dive, and a marketing channel performance dashboard. Use SQL for joins and cohorts, then visualize results in Tableau or Power BI. Add a short, plain-language README for each project explaining insights and business impact.
Are fully remote entry level data analyst jobs realistic, and how competitive are they?
Fully remote entry level data analyst jobs are realistic but highly competitive because they attract global candidates. You improve your odds by targeting hidden junior titles, building a focused SQL and dashboard portfolio, optimizing for ATS, and pairing applications with referral outreach on LinkedIn instead of relying solely on job board submissions.